County Profiles of Child Well-Being in Tennessee
County Profiles: Click on each county name to access profile with overall ranking and information on 52 indicators of child well-being.
2023 County Profiles
Overall County Ranking Quintile Map
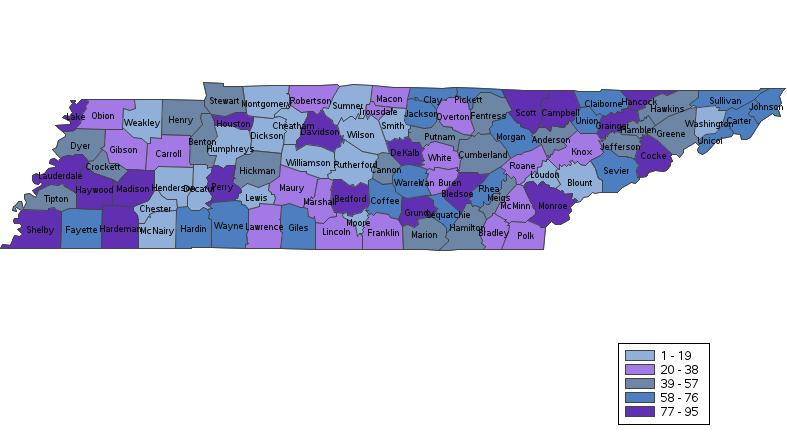
Economic Well-Being Ranking Quintile Map
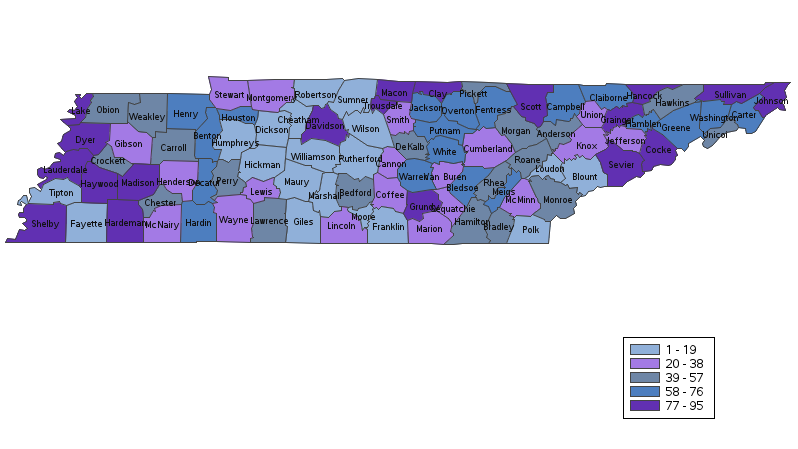
Education Ranking Quintile Map
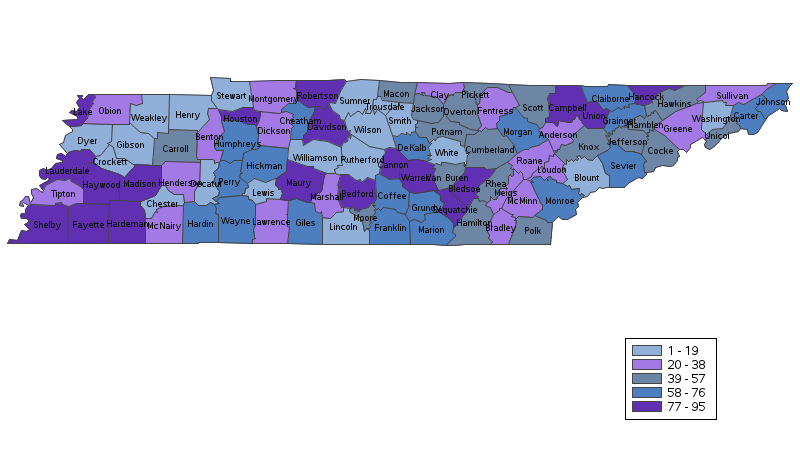
Health Ranking Quintile Map
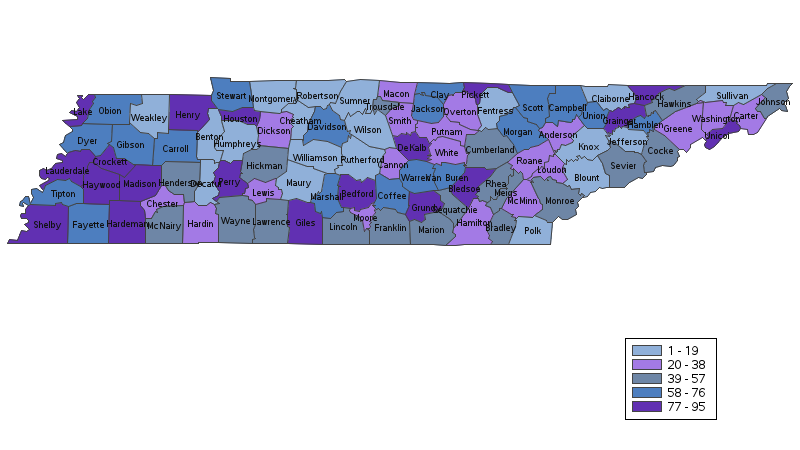
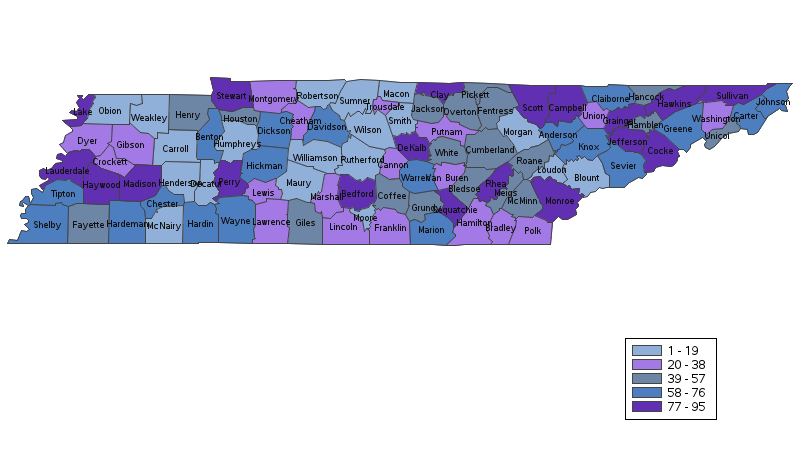
Family & Community Ranking Quintile Map
Questions? Contact Kylie.Graves@tn.gov
Tennessee Index of Child Well-Being Methodology
As a trusted and consistent source for Tennessee data, the TCCY team chose 12 indicators, three in each domain, to make up its Index of Child Well-Being. They were chosen with consideration of important issues in Tennessee, and confined by what is available for all 95 counties.
Indicators were chosen with a preference for measures of outcome rather than process. We tried to avoid using indicators that mostly measure the same thing (such as percent of children living in poverty and percent of children eligible for free and reduced-price lunch). We try to avoid using indicators for which a “better” rate was ambiguous (for instance, a low rate of children receiving SNAP benefits could reflect low poverty rates or poor outreach). We had several changes in indicators compared to previous years, so domain ranks and overall ranks are not directly comparable to those from previous years.
Over the past few years, we have made several changes in indicators as a result of the way the Centers for Disease Control—and, as a result, the Tennessee Department of Health—report data. Counties with small populations can have wide variations in rates in some data categories, especially when just children, or even just a subset of children, are the focus. Child and teen deaths provide a good example. For some counties, a single child death moves them from a rate of 0 per 100,000 to a rate of as high as 80 or 100 per 100,000. In this sense, their rates are not meaningful, and the CDC no longer reports single-year rates at the county level for some indicators when the population of the county is small. This is problematic when one is ranking counties.
For some indicators, we have been able to move to three-year averages and still get data for all counties. For others, we have chosen indicators available at the county level using 5-year American Community Survey Estimates. In both instances, the data reflect a longer period of time. This smooths year-to-year changes, making measures more stable over time, but it also creates more lag. Effects of outside events, such as the pandemic, take much longer to filter through, and it can be more difficult to track and name the changes they cause. Results of policy changes also take more time to show in the data and effects are smaller at first.
We moved away from our two indicators measured in dollars and toward those measured as percents. Still, some work with small rates of children overall and are reported per 1,000 children. Further, within those that are percents, some are high (high school graduation rates run from the mid-80s to the high 90s) and others are low (low birthweight is usually below 10 to 12 percent). With these different scales and magnitudes, they cannot simply be summed to reach an overall rate. To make them comparable, TCCY calculated the z-score for each indicator for each county, summed those for all twelve indicators and ranked the counties based on that total. Sums of the z-scores for the three indicators in each domain serve as the basis for each county’s domain ranks.
For each county, an indicator’s z-score represents the number of standard deviations the value of that indicator is from the average value for all counties. It is calculated as (the difference between a county’s percentage or rate on an indicator and the average value of all counties for that indicator) divided by (the standard deviation for that indicator). This is a common way to make variables or indicators that are measured in different units or have very different scales more comparable. For a full discussion of how to compute z-scores (aimed at non-mathematicians) see this WikiHow explanation.
This year there are several changes to the indicators used, so domain ranks and overall ranks are not comparable to previous years. The indicators below make up this year’s county ranking.
Economic Well-Being
Percent of children living in poverty
Definition: Percent of children living in a household below the federal poverty line.
Source: US Census Bureau Small Area Income and Poverty Estimates (2021).
History in our county rankings: This has been in our county rankings from the beginning.
Severe housing cost burden
Definition: Percent of households that spend 50% or more of their household income on housing.
Source: American Community Survey, 5-year estimates (2017-2021).
History in our county rankings: New to the rankings, this replaces Fair Market Rent, which is produced annually by the US Department of Housing and Urban Development and estimates the amount required to cover rent and utility expenses on 40 percent of the rental housing units in an area. We wanted an indicator more closely aligned to the national rank, one that did not apply only to rental housing, and one expressed as a percent rather than a dollar value.
Child care cost burden
Definition: Child care costs for a household with two children as a percent of median household income.
Source: Produced by the County Health Rankings & Roadmaps (CHR&R) at the University of Wisconsin Population Health Institute using The Living Wage Calculator (2022) and Small Area Income and Poverty Estimates (2021).
History in our county rankings: This is new to the rankings and replaces Median Household Income (MHI). We wanted an indicator expressed as a percentage rather than a dollar amount as well as one that related to a family expense. Income is already somewhat measured in poverty estimates. In addition, this indicator uses MHI in its calculation.
Education
Third to eighth grade reading proficiency
Definition: Percent of third- to eighth-grade students who scored “on-track” or “mastered” on the Tennessee Comprehensive Assessment Program (TCAP) reading and language test.
Source: Tennessee Department of Education (2021-22).
History in our county rankings: This has been in our county rankings from the beginning, though the tests became more rigorous, and the names of score categories changed, in 2017. The name of the test also briefly changed to TNReady, but the Department of Education is moving back to the TCAP name.
Third to eighth grade math proficiency
Definition: Percent of third- to eighth-grade students who scored “on-track” or “mastered” on the Tennessee Comprehensive Assessment program (TCAP) math test.
Source: Tennessee Department of Education (2021-22).
History in our county rankings: This has been in our county rankings from the beginning, though the tests became more rigorous, and the names of score categories changed, in 2017. The name of the test also briefly changed to TNReady, but the Department of Education is moving back to the TCAP name.
High school graduation rate
Definition: Percent of ninth-grade cohort that graduates in four years.
Source: Tennessee Department of Education (2021-22).
History in our county rankings: This has been in our county rankings from the beginning.
Health
Children who lack health insurance
Definition: Percent of children who lack health insurance.
Source: US Census Bureau Small Area Health Insurance Estimates (2020).
History in our county rankings: This has been in our county rankings from the beginning.
Low-birthweight babies
Definition: Percent of live births where baby weighs less than 2,500 grams (5.5 pounds), averaged over three years.
Source: Tennessee Department of Health (2019-21), with three counties estimated using American Community Survey 5-year data (2015-2019, 2016-2020, 2017-21) to estimate a three-year average.
History in our county rankings: This has been in our county rankings from the beginning, though it was previously just one year of data. The Department of Health has tightened its data suppression rules, and dozens of counties’ data were unavailable with one-year numbers. Three-year numbers still left three counties suppressed. Those were estimated from 5-year American Community Survey data.
Child food-insecurity
Definition: Percent of children who are food-insecure, defined by the United States Department of Agriculture as the lack of access, at times, to enough food for an active, healthy life.
Source: Map the Meal Gap (2021).
History in our county rankings: This is new to the rankings and replaces child and teen death rates. Because the Department of Health has tightened its data suppression rules, child and teen death rates, even in a three-year average, lack available data for dozens of counties. We had hoped to use overweight and obesity among public school children, but sample sizes did not allow estimates for 16 counties. We searched for an indicator related to nutrition and healthy eating available for all counties.
Family & Community
Single-parent households
Definition: Single-parent households as a percent of all households with children.
Source: American Community Survey, 5-year estimates (2017-2021).
History in our county rankings: This is new to our county rankings this year. It replaces births to unmarried females, which in turn replaced teen births. As a result of the Tennessee Department of Health tightening its data suppression rules, teen birth data was no longer available for multiple counties. Children born to unmarried females was always an attempt to roughly estimate teen births using different data. As long as we were moving to ACS 5-year estimates over actual counts, we decided to use this indicator over teen births as it is more closely related to long-term family structure.
Chronic Absenteeism
Definition: Children who are absent 10 percent or more of school days for any reason. Data include excused or unexcused absences and out-of-school suspensions.
Source: Tennessee Department of Education (2021-22).
History in our county rankings: This new to our county rankings this year. It replaces school suspensions, which have suppressed data for many systems and counties. This may be partially because suspensions were substantially lower across the state while children were schooling from home during the pandemic. Still, now that we are counting chronic absenteeism, we will likely keep it, even if suspensions rise again to the point that all systems have reported data. Chronic absenteeism is an important predictor of success in school and work.
Victims of child abuse or neglect
Definition: Children who are victims of a case of abuse or neglect. In cases with multiple children each child is counted individually. The total is the number of children associated with substantiated cases of severe abuse and of determinations of “Services Court Ordered“ or “Services Needed” in cases of non-severe abuse or neglect. Children with multiple cases during the year are counted only once. The rate is per 1,000 children.
Source: Tennessee Department of Children’s Services (2021).
History in our county rankings: This has been in our county rankings since the beginning, but we have altered the way we count it. In previous years, we counted substantiated cases, regardless of the number of children involved in the case. Individual cases, even if they covered some or all the same people already attached to a different case, were counted if considered a new case. We have moved to counting children rather than cases. No matter how many children are associated with one case, they are all counted individually. Children who are associated with more than one case during the year are counted only once.